Navigation auf uzh.ch
Navigation auf uzh.ch
ImageGraph is a web-based, open-source rapid prototyping toolkit for Data Science in the Arts, Humanities and Social Sciences. Our toolkit has been in active development since 2019, and we have already contributed significant cash and personnel resources to its development. It is designed to be used at all levels, from bachelor students to early career researchers and junior faculty. Originally conceived for rapid prototyping and teaching in the Digital Humanities, our platform offers an easy-to-use, browser-based no-code visual environment for creating and running complex Python pipelines that include advanced algorithms (e.g. Convolutional Neural Networks) and multimedial data. It empowers students and researchers without a formal programming background to develop their own computational methods and thus bears the characteristics of both a lab and an infrastructure that can be used collaboratively. The project builds on an on-going collaboration between Durham University (DU) and the UZH Center for Digital Visual Studies (DVS) funded by the Max Planck Society (MPG) resulting in the fully functional prototype Imagegraph.cc developed by Leonardo Impett (DU) since mid-2019, and already presented internationally, with a web interface redesigned by Computed·By, and tested with PhD students on behalf of DVS.

Our decentralized architecture has three key components:
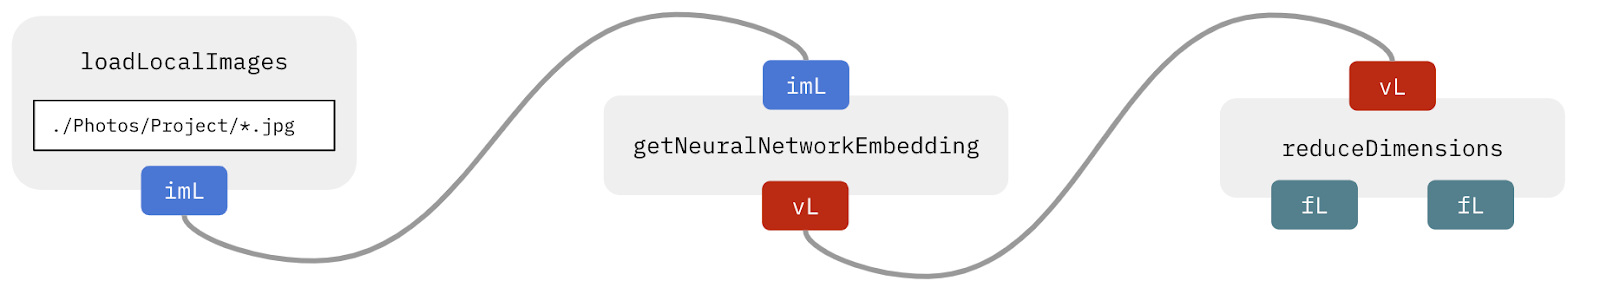
The user designs a visual “script” through our intuitive Data Flow Visual Programming Language, which can be done through any web browser (Figure 1).
This script is compiled into standard Python (importing a family of additional high-level functions through our custom PyImageGraph repository), which is published online automatically as a Github repository. This Github repository includes this Python code in an iPython notebook, which can then be included in an online publication through a number of Open Science integrations (e.g. CodeOcean).
A Google Collaboratory window is automatically opened (including a free-of-charge GPU instance per user), which loads this compiled Python script from Github and can run the program (including loading data and visualising/saving results) in a single click. No software installation or compatibility requirements are necessary at any stage (except a web browser), and because computing is fulfilled by Google Collaboratory, our infrastructure can scale cost-free.
Figure 1 - example of an ImageGraph patch
Our toolbox opens the door for Data Science research (including sophisticated Machine Learning, Computer Vision and Natural Language Processing techniques) to non-experts in different fields at all career stages. Importantly, unlike other tools (e.g. Orange Data Mining, Pure Data), the users are not interacting with traditional software via a user interface - they are themselves programming via a visual programming language. The Python code to which this visual language compiles is made fully visible to the user at all stages; the visual programming language is designed to be closely-tied to the resulting code, such as by color-coding variable types (Figure 1). Users thus engage with (and learn) the fundamentals of computer science (data types, functions vs variables, loops etc) and of practical computer programming (Github, version control) at the same time as prototyping and learning to use advanced Data Science techniques.